Supplemental Article - Chrome Dev Tools
The purpose of this article is to have a quick reference to how to open the Chrome Dev Tools, first covered in "An Introduction to Displaying Web Pages - Part 2". It also includes some extra information added in other lessons.
Opening DevTools
Through a Button
The quickest way to open the DevTools is to push the f12 button.
Through the Right Click Menu
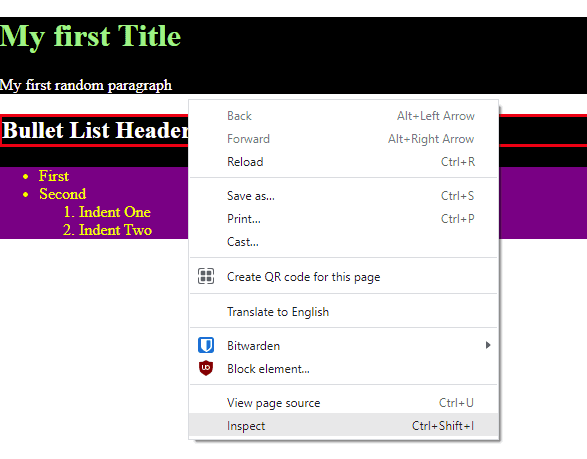
To look at a specific section of the HTML, we will do so by right clicking the area that we are curious about, then clicking Inspect.

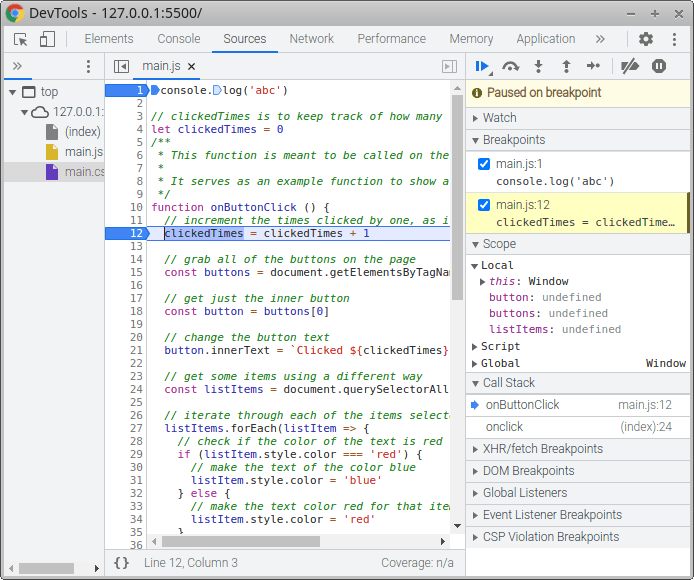
After opening it, you should notice a screen similar to the following.

Adding a Breakpoint
First, we must navigate to the Sources tab of the DevTools if we want to add a breakpoint. This may be done through clicking the filename in the console if available, or manually selecting it.

This tab has a list of files on the left that make up the page, the file open in the middle, and a bunch of expandable areas on the right. One of these is called Breakpoints. When learning how something works in most programming languages, these are super helpful. To create one, simply click on the line number you want it to be on. It will make a blue arrow once it has been created, and appear in the Breakpoints section.


Using a Breakpoint
A breakpoint will become active when the code is about to activate that line. This may mean you need to refresh the page if it is code that happens when the page is loaded. Notice a few things that do and do not happen. First, your webpage darkens and an overlay with "Paused in debugger" appears, as well as a blue play arrow and a clockwise arrow over a dot.

At the same time, the DevTools window has highlighted the line of code, and now we have not only some Breakpoints information, but also Scope and Call Stack. Additionally, the blue play arrow is here as is the text "Paused on breakpoint".

Watching Variables
Open up the Watch section of the tools in order to watch a variable. We can add variables that do not yet exist, as well as any valid Javascript expression to see its value. To add, simply click the + button and put in the code you want to see, much like the console but it will automatically update as you step through the code.


Tags: Practical Programming, Supplemental, DevTools