Web Page Interactive Button Code Investigation Start
The purpose of this article is to learn how to investigate what actually is happening with the button we created last time. We will do so through the Chrome Dev tools, and some explanation.
Code to be Investigated
In the code below, there is a lot going on that we have not really explained, aside from the fact that there are some comments.
1console.log('abc')
2
3// clickedTimes is to keep track of how many times the button has been clicked
4let clickedTimes = 0
5/**
6 * This function is meant to be called on the click of the button.
7 *
8 * It serves as an example function to show a few things.
9 */
10function onButtonClick () {
11 // increment the times clicked by one, as it was just clicked
12 clickedTimes = clickedTimes + 1
13
14 // grab all of the buttons on the page
15 const buttons = document.getElementsByTagName('button')
16
17 // get just the inner button
18 const button = buttons[0]
19
20 // change the button text
21 button.innerText = `Clicked ${clickedTimes} times!`
22
23 // get some items using a different way
24 const listItems = document.querySelectorAll('li:nth-child(2)')
25
26 // iterate through each of the items selected
27 listItems.forEach(listItem => {
28 // check if the color of the text is red
29 if (listItem.style.color === 'red') {
30 // make the text of the color blue
31 listItem.style.color = 'blue'
32 } else {
33 // make the text color red for that item
34 listItem.style.color = 'red'
35 }
36 })
37}
38
Opening DevTools
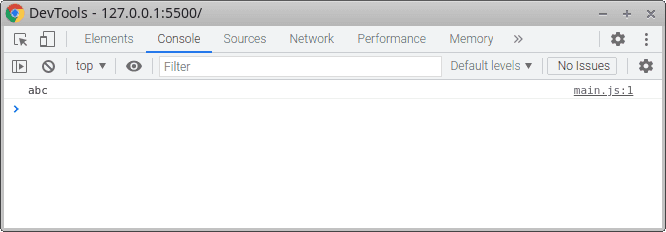
As we did a few lessons ago, we will want to open the Chrome DevTools on our page. This may be done through right-clicking anywhere on the page and selecting Inspect or through the F12 button. Whichever method you choose to use, once open if you go to the Console tab you should see something similar to the following.

Running Our Code Directly in the Console
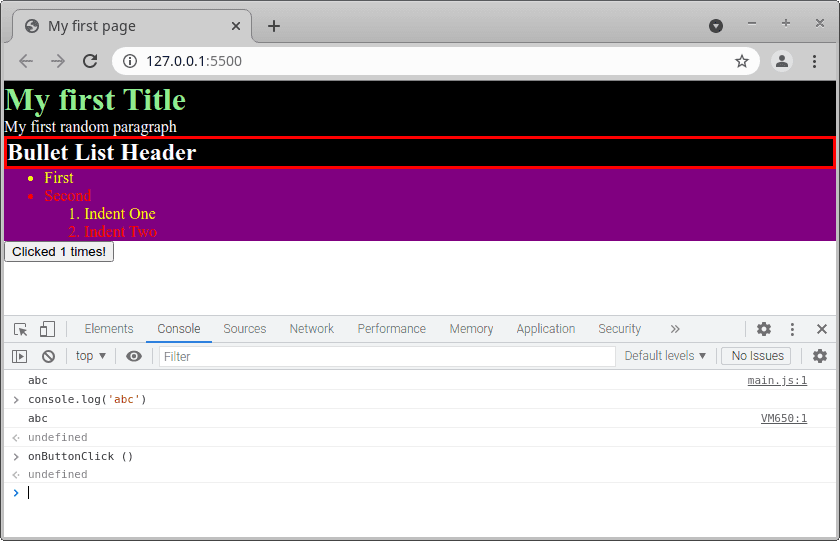
From here, you may actually paste in code from the JavaScript and see things happen. Try doing the first line of code console.log('abc') as well as the function onButtonClick () (without the word function) and see what happens.

Just for fun, you may also want to put 1+1 in and see the results.
What does this mean?
When we pasted in the code, you may have noticed that the button has updated to say that it is clicked now when it has not been, and also that there are two lines that say abc but have something off on the side. In my case, main.js:1 and VM650:1. By clicking this, we can see the source code that produced it, and we will be moved to the Sources tab.

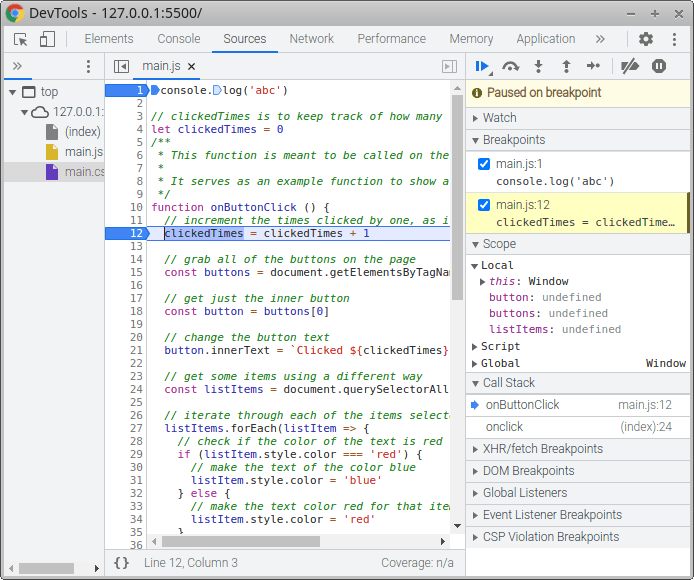
This tab has a list of files on the left that make up the page, the file open in the middle, and a bunch of expandable areas on the right. One of these is called Breakpoints. When learning how something works in most programming languages, these are super helpful. To create one, simply click on the line number you want it to be on. It will make a blue arrow once it has been created, and appear in the Breakpoints section.


Create a breakpoint at the line 1 of the code (console.log('abc')) and line 12 of the code (clickedTimes = clickedTimes + 1), then click the button. Notice a few things that do and do not happen. First, your webpage darkens and an overlay with "Paused in debugger" appears, as well as a blue play arrow and a clockwise arrow over a dot. In addition, the button text has not changed, nor have the list item colors.

At the same time, the DevTools window has highlighted the line of code, and now we have not only some Breakpoints information, but also Scope and Call Stack. Additionally, the blue play arrow is here as is the text "Paused on breakpoint".

Feel free to click the play button, and see the screen change in the manner you had expected before. Note that if you click the button again, the same thing happens. However, we never end up at the line 1 breakpoint.
Try refreshing the page, and you will discover it blank, but that the DevTools have highlighted that first line, and filled in some other information for the Scope and Call Stack area. Push the blue play arrow, and the page will appear. This pausing of the page load is something we will cover at a later date, but helps to illustrate that a breakpoint is used to stop what the browser is doing and look at the details as they happen.
To further experiment, let us go back to the Console tab and once again past in console.log('abc') and onButtonClick (). Notice that only with the second one do we hit the breakpoint, showing that we are getting to the same code there that that we do when we click on the button. However, if we look at the Call Stack area of each way to get there, we will notice a difference.


The reason the we reach the breakpoints we do is because while console.log is a function, it is a function attached to the console object, and onButtonClick is a function that all of our code is able to access, and while all of our code has access to the console object, we would need to place a breakpoint inside of the log function to get it to pause every time.
We are now at a point where we have started using a tool to investigate what is happening, but we need a bit more knowledge about JavaScript syntax to properly understand what that tool is telling us. As such, we will pause our investigation here to dig a little more into the syntax over the next few lessons making use of the Console tab that we have seen can execute code.
Conclusion
We have learned how to pause the code to investigate what is going on, as well as that some code is running before the page displays and some runs in response to something. We have seen that there are several ways to get it to respond, but we have not yet explored the syntax or the why it works the way that it does.
Next - Some Basic JavaScript Concepts
Prior - Web Page Interactive Button
Tags: Practical Programming, JavaScript, Button, Interactive, Debugging